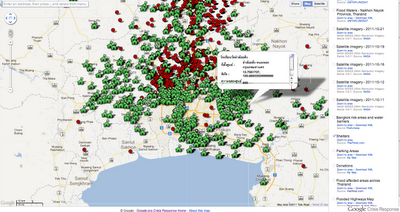
We appreciate the overwhelming response from users in Thailand to help collect and update important information and we continue to invite users to submit new information for layers on the crisis map or send us feedback by clicking the ‘About This Map’ link shown below
เรารู้สึกซาบซึ้งมากกับการตอบสนองของผู้ใช้ในประเทศไทย ที่ช่วยรวบรวมและอัพเดทข้อมูลที่สำคัญ และขอเชิญให้คนที่ต้องการส่งข้อมูลใหม่ๆ หรือแสดงความคิดเห็น คลิกไปที่ “เกี่ยวกับแผนที่” ดังรูป
Flood affected areas
พื้นที่ประสบภัย
Satellite imagery from NASA and radar imagery from Unitar - Unosat indicate the extent of flooding and affected areas across the country.
ภาพถ่ายดาวเทียมจากนาซ่า (NASA) และภาพจากเรดาร์ตรวจอากาศ Unistar-Unosat ระบุตำแหน่งและขอบเขตที่ประสบอุทกภัย
Shelters
ศูนย์อพยพและศูนย์พักพิงสำหรับผู้ประสบอุทกภัย
Daily updates are now available for those seeking emergency accommodation. The green housing icon indicates the location of shelters in and around Bangkok, the capacity the shelter can accommodation and the amount of places still available. Crossed out icons indicate shelters at full capacity.
มีการอัพเดทข้อมูลข่าวสารประจำวันเพื่อเป็นข้อมูลให้กับผู้ที่ต้องการอพยพไปสู่ศูนย์อพยพฉุกเฉิน ไอคอนรูปบ้านสีเขียวจะระบุตำแหน่งของศูนย์ฯ ในเขตกรุงเทพฯ และขีดความสามารถในการรองรับผู้อพยพ นอกจากนั้นยังให้ข้อมูลเกี่ยวกับสถานที่ปลอดภัยที่ยังสามารถโยกย้ายไปได้อีก ส่วนไอคอนที่ไม่สามารถรองรับผู้อพยพได้อีกแล้วจะถูกขีดทับไว้อย่างชัดเจน

Bangkok risk areas and flood barriers
พื้นที่เสี่ยงภัยและแนวคันกั้นน้ำ กรุงเทพฯ
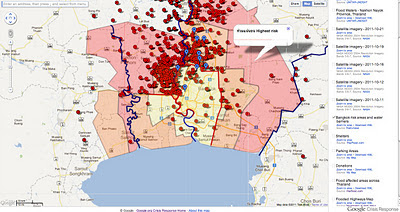
One feature provided by ThaiTV news has received a lot of visitors indicates Bangkok areas at risk of flooding through a red - flooded, orange - high risk and yellow - medium risk colour coded may layer. This feature also shows flood barriers along the Chao Praya River as well as the eastern and western canals being used as diversion routes for water overflow. By using the map zoom in feature, Bangkok residents can identify their street or nearby areas.
อีกฟีเจอร์หนึ่งที่นำเสนอผ่าน ThaiTV ที่มีผู้เข้าชมจำนวนมากเข้าไปแจ้งเกี่ยวกับพื้นที่เสี่ยงน้ำท่วมในกรุงเทพฯ เช่น สีแดง - น้ำท่วมแล้ว สีส้ม - พื้นที่มีความเสี่ยงสูง สีเหลือง - พื้นที่มีความเสี่ยงปานกลาง ซึ่งรหัสสีเหล่านี้มีความแตกต่างกันตามสภาพพื้นที่ ทั้งนี้ฟีเจอร์นี้ยังแสดงแนวกั้นน้ำริมแม่น้ำเจ้าพระยารวมถึงคลองต่างๆ ในฝั่งตะวันออกและตะวันตกของกรุงเทพฯ ที่ใช้เป็นช่องทางเพื่อเบี่ยงการไหลของน้ำ ซึ่งผู้ใช้สามารถซูมเข้า/ออกที่แผนที่เพื่อความชัดเจนและสามารถระบุตำแหน่งถนนที่ตนเองอยู่หรือบริเวณใกล้เคียงอื่นๆ ได้อีกด้วย

Parking
จุดจอดรถในช่วงน้ำท่วม
Users have identified parking spaces for those seeking a safe location for their vehicles. By clicking on the P icon, as shown below, information is provided on the total capacity of car parks and the number of spaces still available as of the date of posting.
การระบุจุดจอดรถในช่วงน้ำท่วมจากผู้ใช้จำนวนมากช่วยให้อีกหลายคนที่ต้องการที่จอดรถที่ปลอดภัย เมื่อคลิกไอค่อน P ดังภาพด่านล่างข้อมูลเกี่ยวกับจำนวนรถรองรับได้ของที่จอดรถแลจำนวนที่จอดรถที่ยังว่างอยู่ ณ วันที่ใส่ข้อมูลนั้นๆ
Donation Centers
จุดรับบริจาคเพื่อผู้ประสบอุทกภัย
If you are looking for a way to help your fellow Thais, donation centers are identified through the shopping bag icons below. By clicking on an icon you can find the name of the donation center, it’s address and where available, a phone number. We advise anyone planning on visiting a donation center to volunteer or drop off goods to call in advance and confirm the center is open during the public holidays.
Photos uploaded from Android phones
ภาพเกี่ยวกับน้ำท่วมที่แชร์ผ่านมือถือระบบ Android
Users, with the help of a special application by Ansur, have recently begun sharing photos taken on Android phones as a new layer to the crisis map. We are working with this user group to share more information for those interested in sharing photos taken from their phones and will provide additional information as soon as it is available.
แอพพลิเคชั่นพิเศษจาก Ansur ทำให้ผู้ใช้แบ่งปันภาพถ่ายจากโทรศัพท์มือถือระบบ Android ที่ระบุตำแหน่งวิกฤตต่างๆ ในแผนที่ ซึ่งเรากำลังทำงานร่วมกับกลุ่มผู้ใช้นี้เพื่อแบ่งปันข้อมูลเพิ่มเติมให้กับผู้ที่สนใจ และจะแจ้งให้ทราบอย่างต่อเนื่องเมื่อมีการอัพเดทใดๆ
As you move the mouse pointer in the 3D viewer, the elevation of the terrain beneath the pointer is displayed in the lower left corner of the 3D viewer. By default, the display of elevation is in feet and miles when high enough.
เมื่อผู้ใช้เลื่อนเมาส์ไปที่มุมมองแบบสามมิติ (3D viewer) ระดับสูงต่ำของสภาพภูมิประเทศในบริเวณนั้นจะแสดงอยู่ตรงมุมด้านล่างซ้ายมือของ “มุมมองแบบสามมิติ” ซึ่งจะแสดงหน่วยเป็นฟุตและไมล์